Two types of evidence, one report
You surveyed 200 employees. You interviewed 15 team leads. Now you need to write a research report that weaves together the numbers and the stories. The survey says 68% of respondents feel their feedback is ignored. The interviews explain why. Both matter. Neither tells the full picture alone.
Most consultants work this way: open the CSV in Excel, make charts, screenshot them, paste into Word, then write the narrative around the screenshots. The data lives in one tool. The writing lives in another. The AI assistant, if they use one, lives in a third. Nothing talks to anything else.
Every time you want to reference a specific data point while writing, you switch windows. Every time you want the AI to help interpret a trend, you paste a table into a chat window and explain the context from scratch.
Data and prose in one workspace
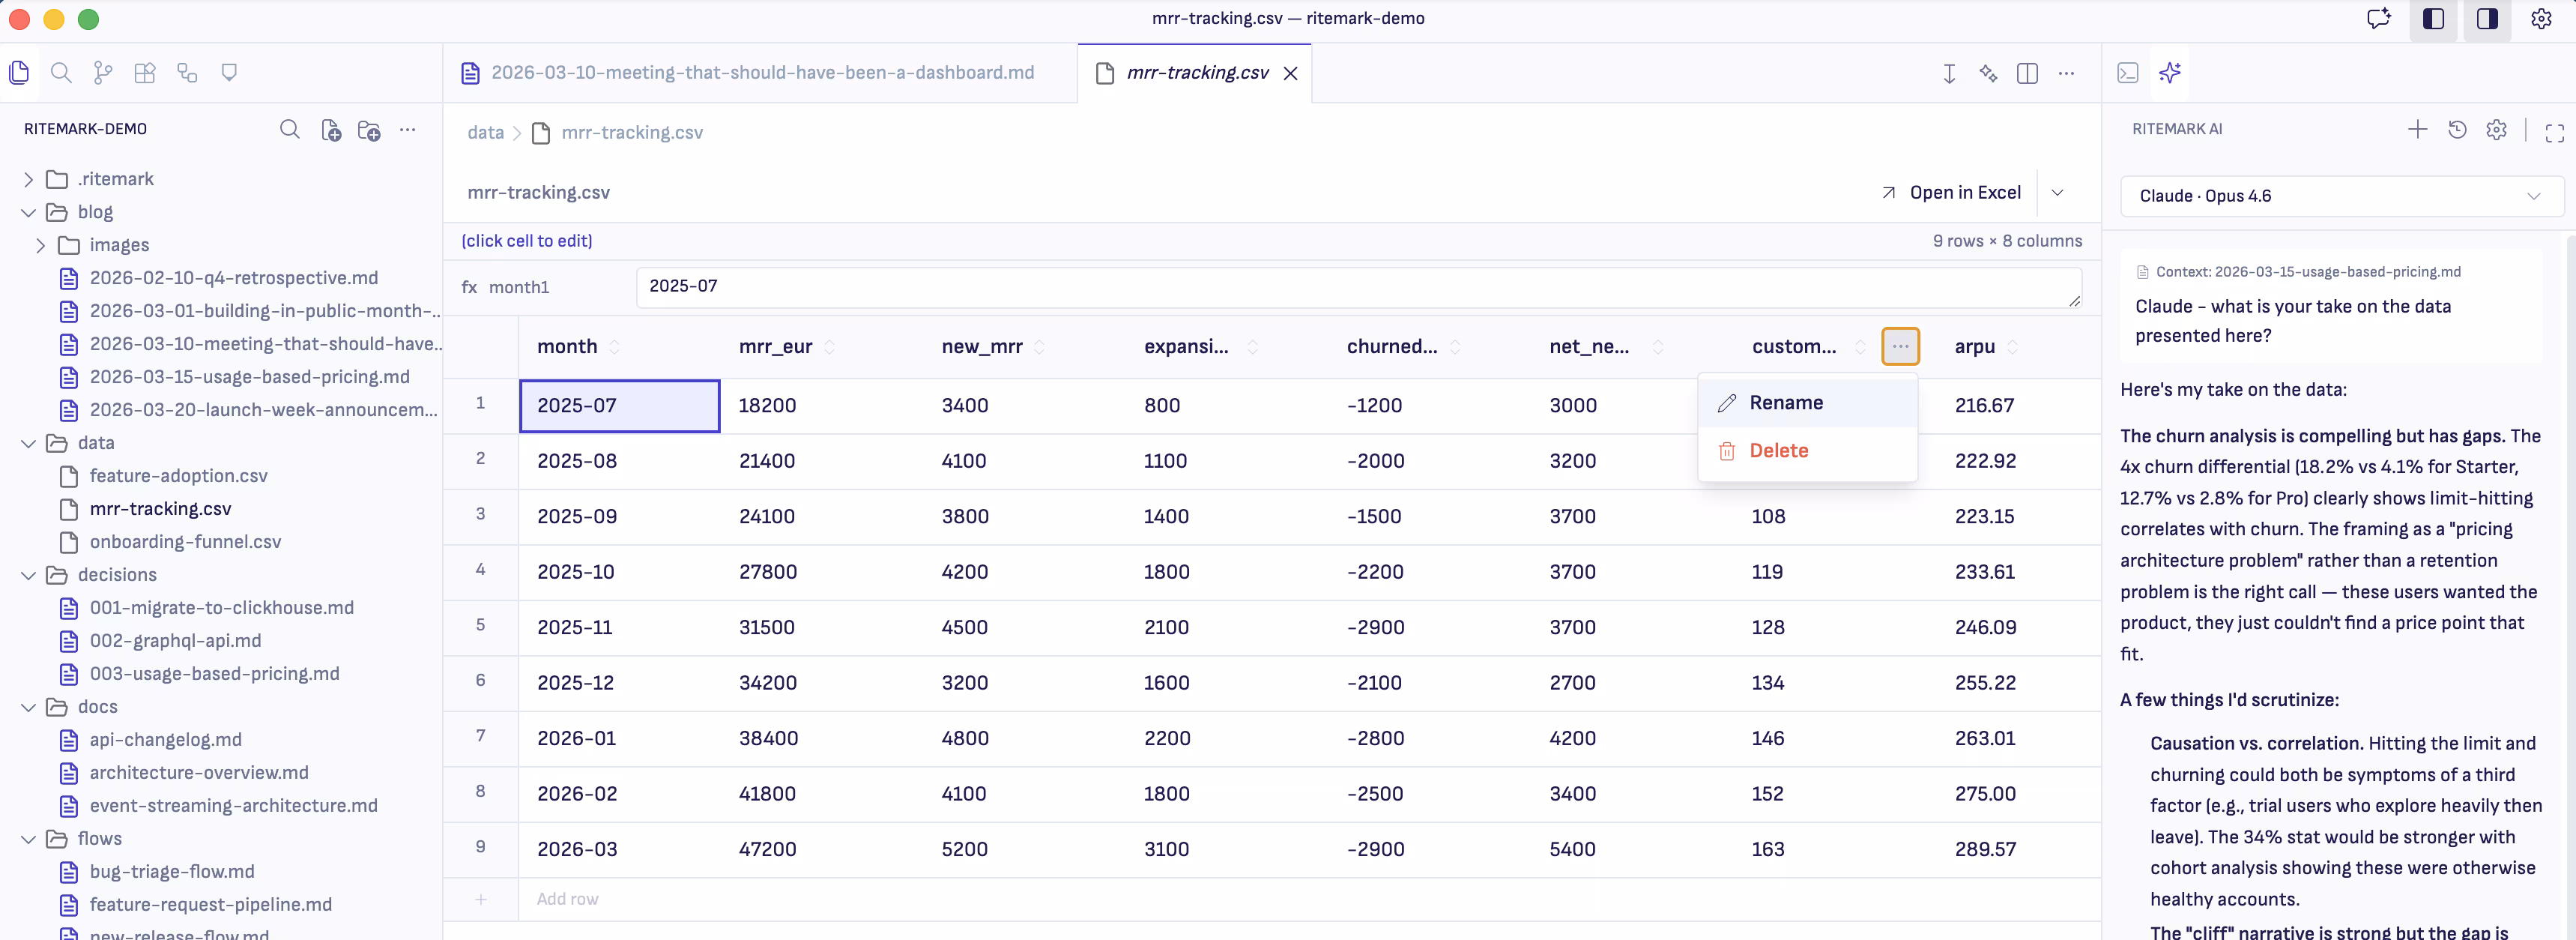
Ritemark's data editor opens CSV files directly. Your survey results sit in the same project folder as your interview transcripts and your report draft. You can look at the data, read the transcripts, and write the report without leaving the workspace.
Open your project folder. It has survey-results.csv, five interview transcript files, and research-report.md. The data editor shows you the CSV with sortable columns. Your interview files are plain markdown. Your report is where everything comes together.
When you start the AI agent, it can read all of these. The survey data, the transcripts, and whatever you have written so far. You are not copying and pasting between windows. The agent sees the same workspace you see.
Building the report from evidence
You start with the quantitative findings. "Look at the survey results CSV. Summarize the key trends. Focus on questions where responses are strongly skewed, either very positive or very negative."
The agent reads the data and highlights that communication satisfaction drops sharply in teams larger than 12 people, and that remote employees rate tool satisfaction 23 points lower than office-based staff. You did not spot the team-size correlation in your initial scan of the data.
Then you layer in the qualitative insights. "Read the interview transcripts. Find quotes and observations that explain or contradict the survey trends you just identified."
The agent pulls a quote from a team lead who manages 18 people: "I send updates but I honestly don't know if anyone reads them." That quote puts a human face on the 68% statistic. It goes straight into your report.
Why this combination matters
Research reports that only show numbers feel cold. Reports that only tell stories feel anecdotal. The strength is in the combination, and the combination is hard to produce when your data, your notes, and your writing environment are scattered across different tools.
With everything in one folder, the AI agent becomes a research assistant that actually knows the full picture. It can cross-reference a survey trend with an interview quote without you having to explain either one. Your job stays where it should be: interpreting, framing, and telling the story that the evidence supports. The mechanical work of finding connections and pulling citations happens in the background.