Raw text is not how you should read data
Open a CSV file in most writing tools and you get a wall of commas. Column headers blur into values, every row looks identical, and finding the one number you need takes way too long. Some editors try syntax highlighting, but coloring commas different shades of gray does not make a spreadsheet readable.
The problem gets worse with larger files. A 500-row CSV is hard enough to scan as text. A 5000-row export from your analytics tool is essentially unusable without a proper table view.
Ritemark renders your data as a table
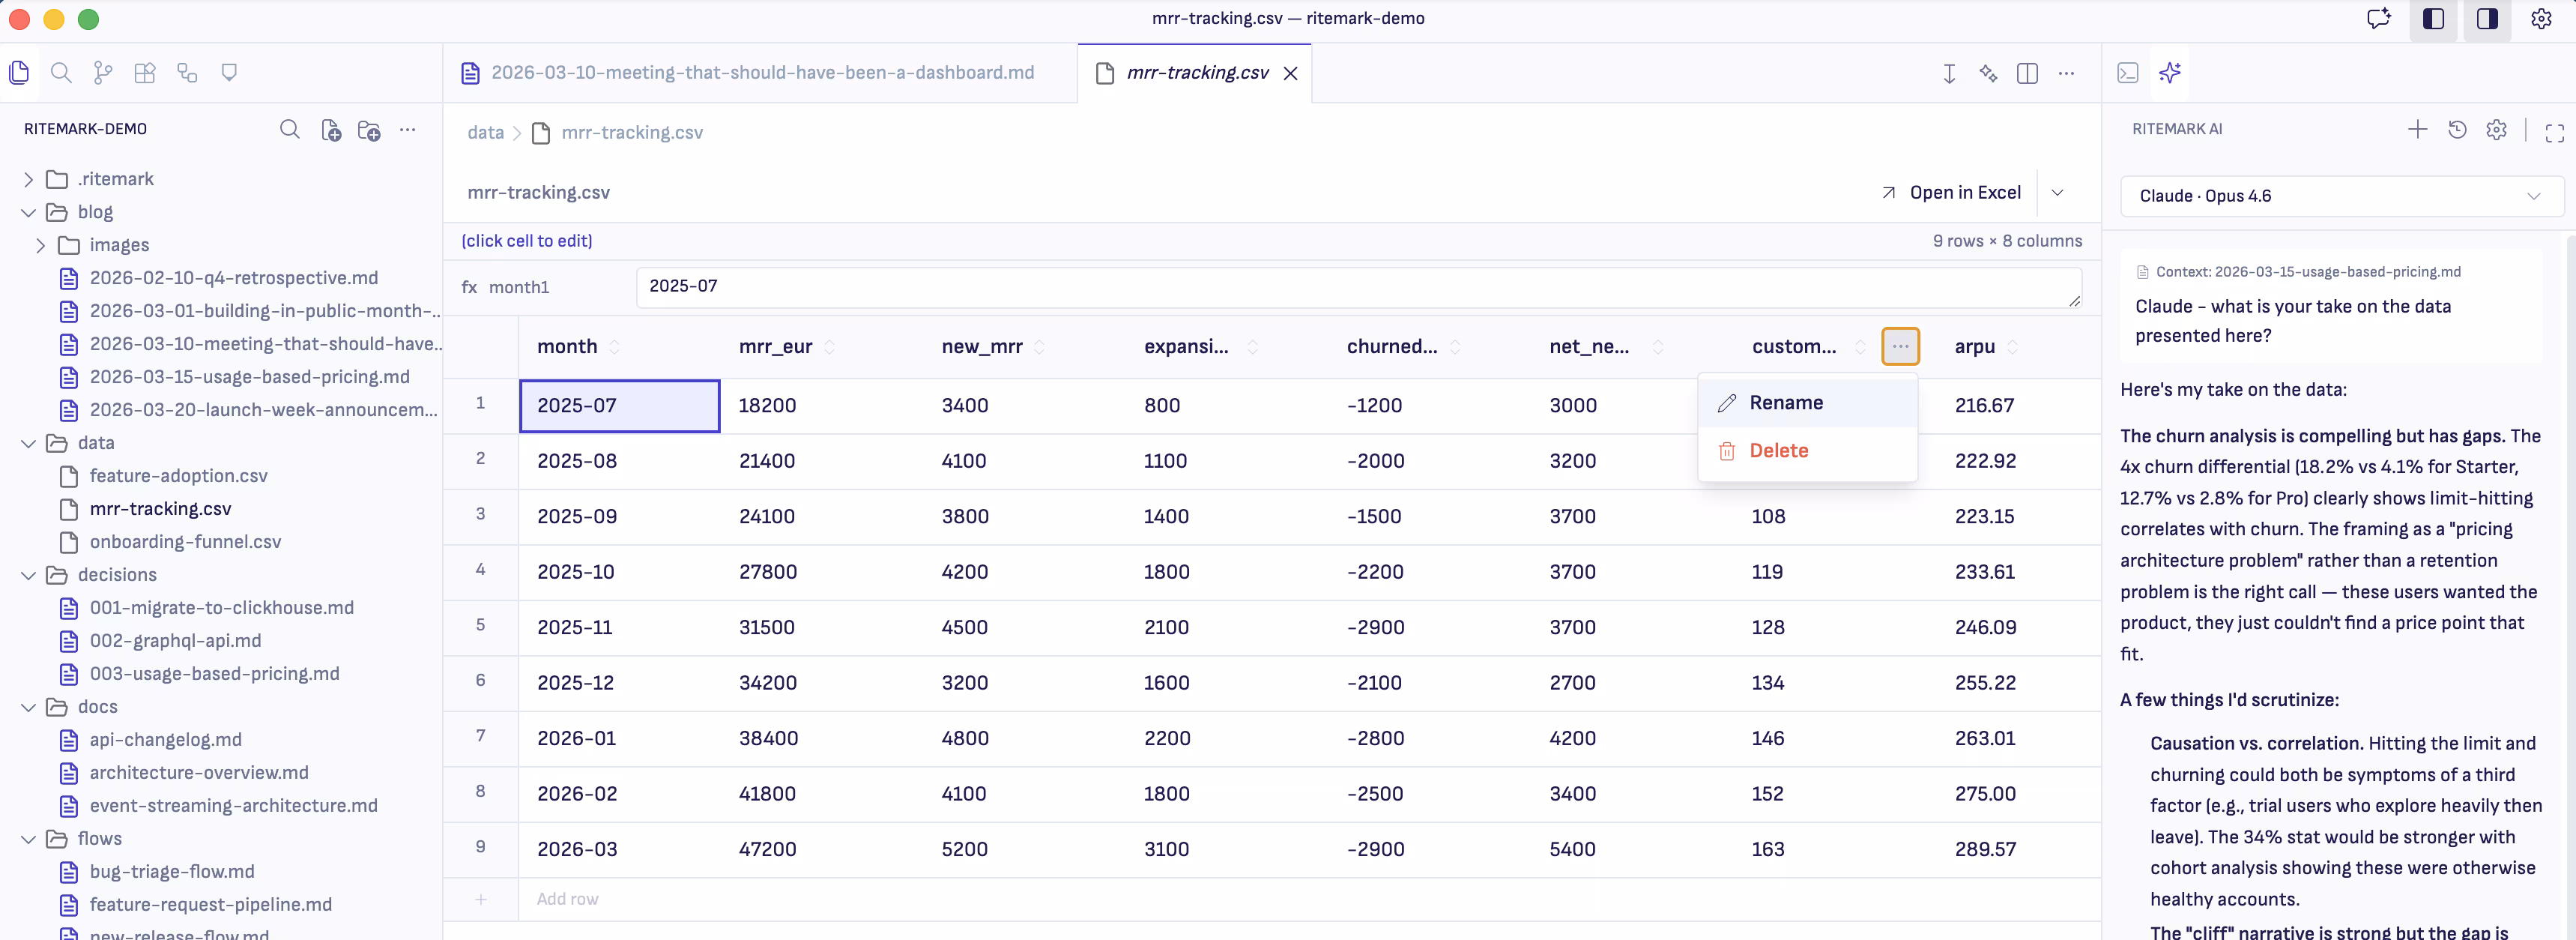
When you open a CSV file in Ritemark, you see a real spreadsheet table. Columns have headers. Rows are separated visually. Cells are aligned and easy to scan. The file itself stays as a plain CSV on your hard drive, but the editor presents it in a way that makes sense for human eyes.
Ritemark uses PapaParse under the hood for CSV parsing. It handles quoted fields, different delimiters, and edge cases that trip up simpler parsers. For Excel files, Ritemark uses SheetJS to read .xlsx and .xls formats and display them as read-only tables. You get a proper preview without needing Microsoft Office or Google Sheets open in another window.
Sort, filter, and edit without leaving your editor
The data editor is not just a viewer. Click a column header to sort by that column. Use the filter controls to narrow down rows by value. Need to fix a typo in a cell? Click and edit it directly. Changes save back to the original CSV file.
This is useful when you are writing a report and referencing data at the same time. Instead of switching to a spreadsheet application to check a number, you open the CSV in a tab right next to your document. The data is there when you need it, and out of the way when you do not.
Data files live alongside your writing
Most writing tools treat data and prose as completely separate concerns. You write in one application and manage your data in another. Your spreadsheets live in Google Drive while your documents are in some other folder.
Ritemark takes a different approach. Your project folder can contain markdown files, CSV files, Excel exports, and images all together. Open a markdown file for writing, then open a CSV file in another tab for reference. Everything is part of the same project, versioned in the same Git repository if you use one.
A writing tool that actually handles data
Ritemark is a writing environment first. But writing does not happen in isolation. Reports reference data. Blog posts cite statistics. Project documentation includes metrics. Having a proper data viewer built into the same tool where you write removes one more reason to break your focus and switch applications.
Download Ritemark and open your first CSV file in a real table view.